we provide Actual Microsoft 70-779 testing engine which are the best for clearing 70-779 test, and to get certified by Microsoft Analyzing and Visualizing Data with Microsoft Excel (beta). The 70-779 Questions & Answers covers all the knowledge points of the real 70-779 exam. Crack your Microsoft 70-779 Exam with latest dumps, guaranteed!
Online Microsoft 70-779 free dumps demo Below:
NEW QUESTION 1
You have two queries named Client and Invoices. A sample of Client is shown in the following table.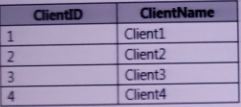
A sample of Invoices is shown in the following table.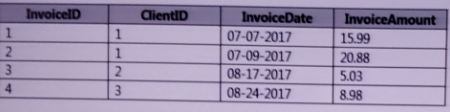
You need to create a new table that has the following information.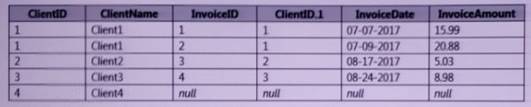
Which join kind should you use?
- A. Inner
- B. Left Outer
- C. Right Anti
- D. Left Anti
Answer: B
Explanation:
https://www.excelguru.ca/blog/2015/12/16/merge-tables-using-outer-joins-in-power-query/
NEW QUESTION 2
Note: This question is part of a series of questions that present the same scenario. Each question in the series contains a unique solution that might meet the stated goals. Some question sets might have more than one correct solution, while others might not have a correct solution.
After you answer a question in this section, you will NOT be able to return to it. As a result, these questions will not appear in the review screen.
You have a Power Pivot model that contains the following tables.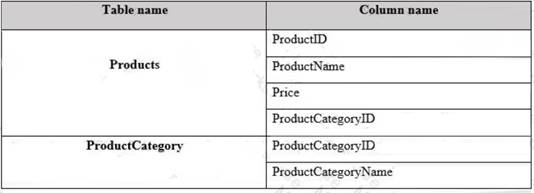
There is a relationship between Products and ProductCategory.
You need to create a hierarchy in Products that contains ProductCategoryName and ProductName. Solution: You create a calculated column that uses the RELATED DAX function
Does this meet the goal?
- A. Yes
- B. No
Answer: A
Explanation:
References:
https://www.mssqltips.com/sqlservertip/2900/creating-hierarchies-in-powerpivot-for-excel/ https://msdn.microsoft.com/en-us/library/ee634202.aspx
NEW QUESTION 3
You have an Excel workbook query that loads data to a worksheet and the data model. You need to ensure that the data is refreshed whenever you open the workbook.
What should you do?
- A. From the File tab, click Option, and then modify the Data option.
- B. From the File tab, click Options, and then modify the General options.
- C. From the Data tab, click Queries & Connections, and then edit the properties of the query.
- D. From the Power Pivot model, modify the Table Behavior setting.
Answer: C
Explanation:
https://support.office.com/en-us/article/refresh-an-external-data-connection-in-excel-2021-for-windows-152417
NEW QUESTION 4
Note: This question is part of a series of questions that use the same scenario, For your convenience the scenario is repeated in each question. Each question presents a different goal and answer choices, but the text of the scenario is the same in each question in this series.
Start of repeated scenario
You are creating reports for a car repair company. You have four datasets in Excel spreadsheets. Four workbook queries load the datasets to a data model. A sample of the data is shown in the Data Sample exhibit.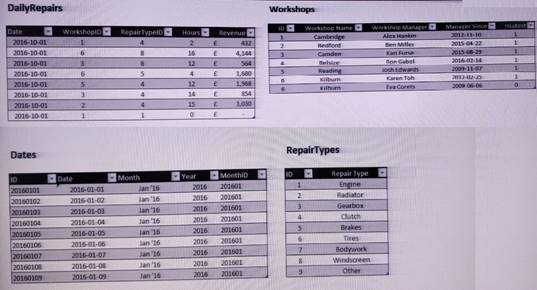
The data model is shown in the Data Model exhibit.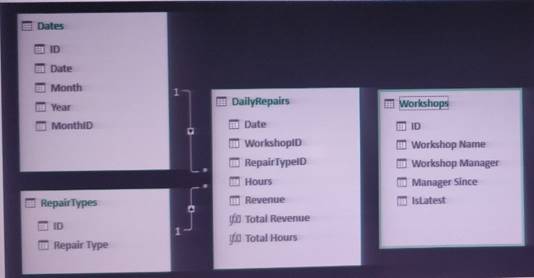
The tables in the model contain the following data:
DailyRepairs has a log of hours and revenue for each day, workshop, and repair type. Every day, a log entry is created for each workshop, even if no hours or revenue are recorded for that day. Total Hours and Total Revenue are two measures defined in DailyRepairs. Total Hours sums the Hours column, and Total Revenue sums the Revenue column.
Workshops has a list of all the workshops and the current and previous workshop managers. The format of the Workshop Manager column is always Firstname Lastname. A value of 1 in the IsLatest column indicates that the workshop manager listed in the record is the current workshop manager.
RepairTypes has a list of alt the repair types. Dates has a list of dates from 2015 to 2021. End of repeated scenario.
You plan to analyze The average revenue per hour by combinations of day, repair type, and workshop name. You need to create a measure to support the planned analysis.
Which DAX formula should you use? To answer, drag the appropriate values to the correct targets. Each value may be used once, more than once, or not at all. You may need to drag the split bar between panes or scroll to view content.
NOTE: Each correct selection is worth one point.
- A. Mastered
- B. Not Mastered
Answer: A
Explanation:
DIVIDE ([Total Revenue ],[ Total Hours], BLANK())
NEW QUESTION 5
Note: This question is part of a series of questions that use the same scenario. For your convenience, the scenario is repeated in each question. Each question presents a different goal and answer choices, but the text of the scenario is the same in each question in this series.
Start of repeated scenario.
You are creating reports for a car repair company. You have four datasets in Excel spreadsheets. Four workbook queries load the datasets to a data model. A sample of the data is shown in the Data Sample exhibit. (Click the Exhibit button.)
Data Sample exhibit: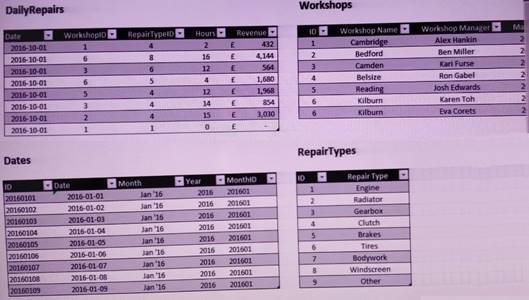
The data model is shown in the Data Model exhibit. (Click the Exhibit button.)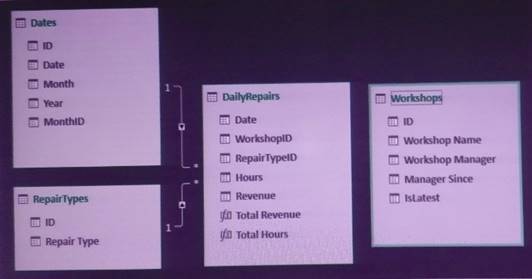
The tables in the model contain the following data: DailyRepairs has a log of hours and revenue for each day, workshop, and repair type. Every day, a log entry is created for each workshop, even if no hours or revenue are recorded for that day. Total Hours and Total Revenue column. Workshops have a list of all the workshops and the current and previous workshop managers. The format of the Workshop Manager column is always Firstname Lastname. A value of 1 in the IsLatest column indicates that the workshop manager listed in the record is the current workshop manager.
 RepairTypes has a list of all the repair types Dates has a list of dates from 2015 to 2021
End of repeated scenario.
You need to create a PivotChart that displays the month, the hours of the month, and the hours of the previous month, as shown in the following exhibit.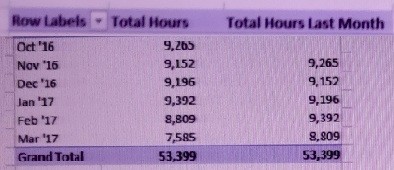
Which DAX formula should you use for the Total Hours Last Month measure? To answer, drag the appropriate fields to the correct targets. Each value may be used once, more than once, or not at all. You may need to drag the split bar between panes or scroll to view content.
NOTE: Each correct selection is worth one point.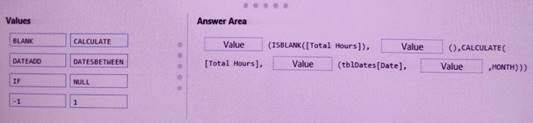
- A. Mastered
- B. Not Mastered
Answer: A
Explanation:
IF (ISBLANK[(Total Hours]),BLANK(), CALCULATE([total Hours], DATEADD(tblDates(Date),
-1,MONTH)))
NEW QUESTION 6
Note: This question is part of a series of questions that present the same scenario. Each question in the series contains a unique solution that might meet the stated goals. Some question sets might have more than one correct solution, while others might not have a correct solution.
After you answer a question in this section, you will NOT be able to return to it. As a result, these questions will not appear in the review screen.
You have a query named Queryl that retrieves the user information from two Excel files. One of the Excel files does not contain location information. A sample of the data retrieved by the query is shown in the following table.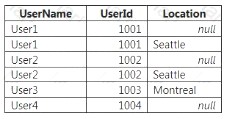
You need to ensure that values in UserName are unique. The solution must ensure that the locations are retained. A sample of desired output is shown in the following table.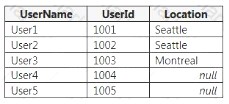
Solution: You select the UserName and Location columns, and then you click Keep Duplicates. Does this meet the goal?
- A. Yes
- B. No
Answer: B
NEW QUESTION 7
You have the PivotTable shown in the following exhibit.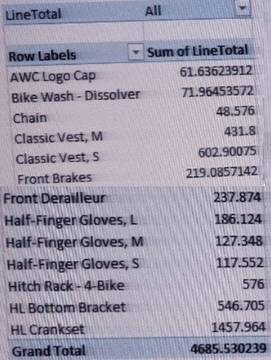
You need to display only rows in the PivotTable in which the sum of LineTotal is greater than 100. What should you do?
- A. From Row Label, configure a Label filter.
- B. Add a slicer for LineTotal and select the values from the slicer.
- C. From Row Label, configure a Value Filter.
- D. Add LineTotal to the Filters area of PivotTable Field
- E. Configure the Filters value.
Answer: B
NEW QUESTION 8
Note: This question is part of a series of questions that present the same scenario. Each question in the series contains a unique solution that might meet the stated goals. Some question sets might have more than one correct solution, while others might not have a correct solution.
After you answer a question in this section, you will NOT be able to return to it. As a result, these questions will not appear in the review screen.
You have two Microsoft SQL Server database servers named Production1 and Test1. Production1 contains the same tables as Test1, but only a subset of the data.
You add Test1 as a data source, and you select 10 tables. You configure several transformations. You need to connect the model to the tables in Production1. The solution must maintain the existing
transformations.
Solution: From Query Editor, you configure the Data source settings. Does this meet the goal?
- A. Yes
- B. No
Answer: A
NEW QUESTION 9
Note: This question is part of a series of questions that use the same scenario. For your convenience, the scenario is repeated in each question. Each question presents a different goal and answer choices, but the text of the scenario is the same in each question in this series.
Start of repeated scenario.
You have six workbook queries that each extracts a table from a Microsoft Azure SQL database. The tables are loaded to the data model, but the data is not loaded to any worksheets. The data model is shown in the Data Model exhibit. (Click the Exhibit button.)
Exhibit: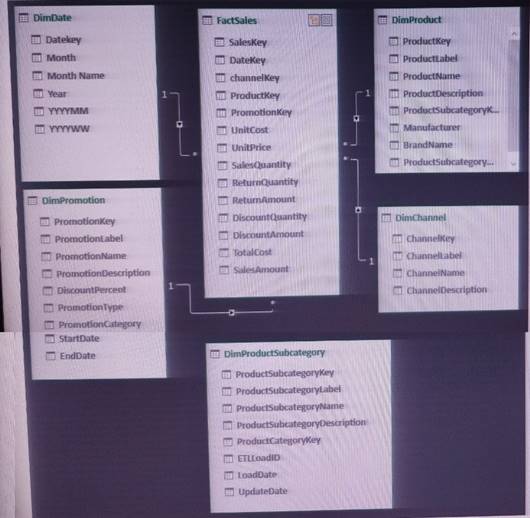
Your company has 100 product subcategories and more than 10,000 products. End of repeated scenario.
You plan to use the DAX time intelligence functions of DATEADD and DATESMTD. You need to ensure that the functions return the correct data.
What should you do first?
- A. Delete and recreate the relationship between FactSales and DimDate.
- B. Change the Data Type of FactSales[DateKey].
- C. Mark DimDate as the date table.
- D. Change trie Data Type of DimDate[DateKey].
Answer: C
Explanation:
https://docs.microsoft.com/en-us/sql/analysis-services/lesson-3-mark-as-date-table?view=sql-analysis-services-2
NEW QUESTION 10
Note: This question is part of a series of questions that present the same scenario. Each question in the series contains a unique solution that might meet the stated goals. Some question sets might have more than one correct solution, while others might not have a correct solution.
After you answer a question in this section, you will NOT be able to return to it. As a result, these questions will not appear in the review screen.
You have the following data.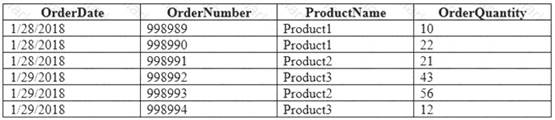
You need to retrieve a list of the unique ProductName entries.
Solution: Create a PivotTable that uses the ProductName field in the Rows area. Does this meet the goal?
- A. Yes
- B. No
Answer: B
NEW QUESTION 11
Note: This question is part of a series of questions that use the same scenario. For your convenience, the scenario is repeated in each question. Each question presents a different goal and answer choices, but the text of the scenario is the same in each question in this series.
Start of repeated scenario
You have six workbook queries that each extracts a table from a Microsoft Azure SQL database. The tables are loaded to the data model, but the data is not loaded to any worksheets. The data model is shown in the Data Model exhibit.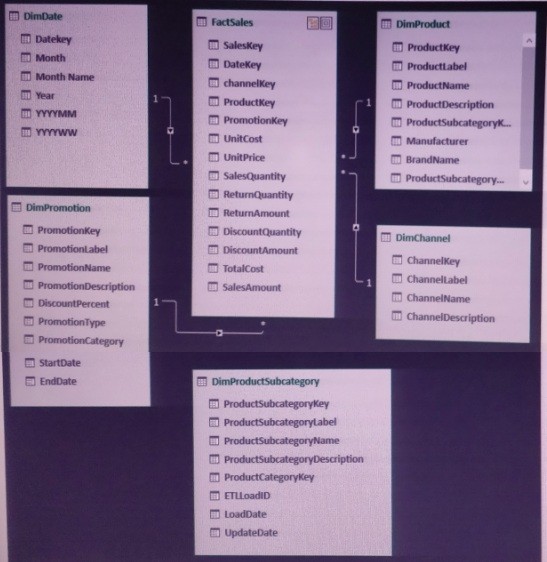
Your company has 100 product subcategories and more than 10,000 products. End of repeated scenario.
You need to create a simplified view of the workbook for some users. The simplified view must only display data from FactSales, DimProduct, and DimDate.
What should you do in the data model?
- A. Click Hide from Client Tolls for all the tables except FactSales, DimProduct, and DimDate.
- B. Create a new perspective.
- C. Modify the Table Behavior settings for FactSales, DimProduct, and DimDate.
- D. Add the columns from FactSales, DimProduct, and DimDate to the Default Field Set.
Answer: A
NEW QUESTION 12
You have a model that contains data relating to corporate profits. The model contains a measure named Profit.
You need to create a PivotTable to display the Profit measure in three different formats by using the Show Value As feature. The PivotTable must produce the results shown in the following table.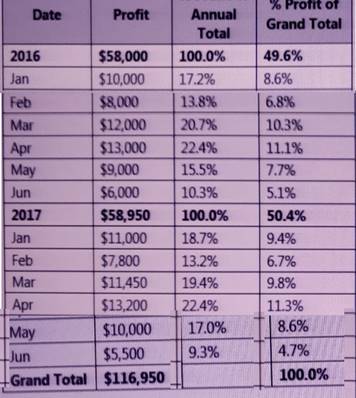
How should you configure the Show Value As feature for % Profit of Annual Total and % profit of Grand Total? To answer, select the appropriate options in the answer area.
NOTE: Each correct selection is worth one point.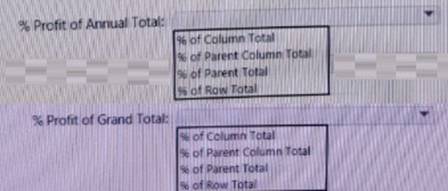
- A. Mastered
- B. Not Mastered
Answer: A
Explanation:
% Profit of Annual Total: % of Parent Total
% Profit of Grand Total: % of Column Total
https://support.office.com/en-us/article/show-different-calculations-in-pivottable-value-f ields-014d2777-baaf-480b-a32b-98431f48bfec
NEW QUESTION 13
You import the data from two next files into a PowerPivot model to create two tables named Customers and Invoices. Each table contains a column named CustomerID.
When you attempt to create a relationship between the Customers table and the Invoices table by using the CustomerID column from each table, the relationship cannot be created due to duplicate CustomerID values.
You need to ensure that you can create the relationship. What should you do?
- A. Add an index column to the Customers query
- B. Add an index column to the Invoices query
- C. Group the Customers query by CustomerID
- D. Sort the Invoices query by CustomerID, and then add a Fill Down step
Answer: C
NEW QUESTION 14
Note: This question is part of a series of questions that present the same scenario. Each question in the series contains a unique solution that might meet the stated goals. Some question sets might have more than one correct solution, while others might not have a correct solution.
After you answer a question in this section, you will NOT be able to return to it. As a result these questions
will not appear in the review screen.
You have two Microsoft SQL Server database servers named Production1 and Test1. Production1 contains the same tables as Test1, but only a subset of the data.
You add Test1 as a data source, and you select 10 tables. You configure several transformations. You need to connect the model to the tables in Production1. The solution must maintain the existing
transformations.
Solution: From Query Editor, you edit the source of each table query. Does this meet the goal?
- A. Yes
- B. No
Answer: B
NEW QUESTION 15
You use a workbook query to import a table named Customers that contains a column named CustomerName. CustomerName has names in the format of Lastname, Firstname.
You need the CustomerName column to contain names in the format of Firstname Lastname. A space must separate Firstname and Lastname.
Which two commands should you use? To answer, drag the appropriate fields to the correct areas. Each field may be used once, more than once, or not at all. You may need to drag the split bar between panes or scroll to view content.
NOTE: Each correct selection is worth one point.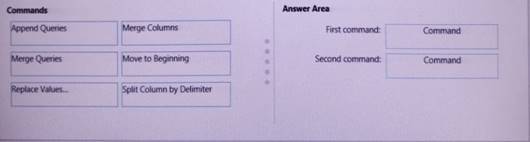
- A. Mastered
- B. Not Mastered
Answer: A
Explanation:  Split Column By Delimiter Merge Columns
https://support.office.com/en-us/article/split-a-column-of-text-power-query-5282d425-6dd 0-46ca-95bf-8e0da9539662
https://support.office.com/en-us/article/merge-columns-power-query-80ec9e1e-1eb6-4048-b500-d5d42d9f0
NEW QUESTION 16
Your company has sales offices in several cities.
You create a table that represents the amount of sales in each city by month as shown in the exhibit.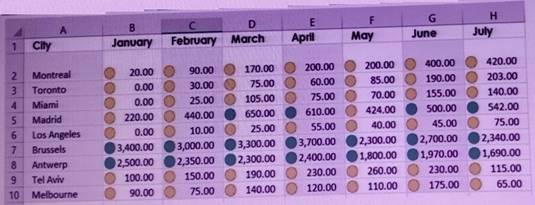
You need to ensure that all values lower than 250 display a red icon. The solution must ensure that all values greater than 500 display a green icon.
Solution: You create a measure, and then define a target value. Does this meet the goal?
- A. Yes
- B. No
Answer: B
NEW QUESTION 17
Note: This question is part of a series of questions that present the same scenario. Each question in the series contains a unique solution that might meet the stated goals. Some question sets might have more than one correct solution, while others might not have a correct solution.
After you answer a question in this section, you will NOT be able to return to it. As a result, these questions will not appear in the review screen.
You have the following data.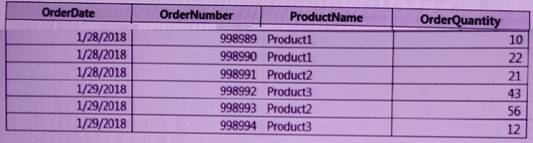
You need to retrieve a list of the unique ProductName entries.
Solution: Open the Advanced Filter dialog box, select Filter the list, in-place, and then select Unique records only.
Does this meet the goal?
- A. Yes
- B. No
Answer: A
NEW QUESTION 18
You have a pie chart.
You need the wedges of the pie chart to be separated as shown in the following exhibit.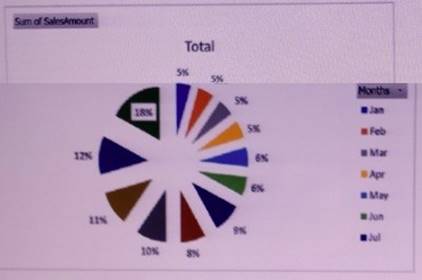
- A. Change the chart type to Pie of Pie.
- B. Right-click the pie chart, click Expand/Collapse, and then click Expand.
- C. Right-click the pie chart, click Expand/Collapse, and Then click Expand Entire Field
- D. Select a wedge of the pie chart and then drag the wedge.
Answer: D
NEW QUESTION 19
Note: This question is part of a series of questions that present the same scenario. Each question in the series contains a unique solution that might meet the stated goals. Some question sets might have more than one correct solution, while others might not have a correct solution.
After you answer a question in this section, you will NOT be able to return to it. As a result, these questions will not appear in the review screen.
You have two Microsoft SQL Server database servers named Production1 and Test1. Production1 contains the same tables as Test1. but only a subset of the data.
You add Test1 as a data source, and you select 10 tables. You configure several transformations. You need to connect the model to the tables in Production1. The solution must maintain the existing
transformations.
Solution You create a new connection to Production1, and then you import the tables. Does this meet the goal?
- A. yes
- B. No
Answer: B
NEW QUESTION 20
You have a table that contains data relating to exam candidates and their associated scores.
You need to visualize the exam data by separating the data into quartiles. The visualization must display the mean score and must identify any outliers.
Which type of chart should you use?
- A. line
- B. histogram
- C. pie
- D. box and whisker
Answer: D
Explanation:
https://support.office.com/en-us/article/create-a-box-and-whisker-chart-62f4219f-db4b-4754-aca8-4743f6190f0
NEW QUESTION 21
......
P.S. Easily pass 70-779 Exam with 117 Q&As prep-labs.com Dumps & pdf Version, Welcome to Download the Newest prep-labs.com 70-779 Dumps: https://www.prep-labs.com/dumps/70-779/ (117 New Questions)